About this report
In 2021, Taxi Butler launched its first edition of the Global Taxi Industry Trends Report, a comprehensive look at dynamic trends in the global taxi industry, presenting data before, during, and after the COVID-19 pandemic.
This second edition of the Global Taxi Industry Trends Report highlights challenges and successes, covering January through June 2022 in four major regions: the UK & Ireland, North America, Australia & New Zealand, and Europe. This report also takes a deeper dive into topics like the global driver shortage and taxi booking across different venues. The data presented is collected from Taxi Butler's booking devices installed in venues worldwide, providing insights into the business-to-business (B2B) taxi booking industry.
Key takeaways
growth for the taxi industry in H1 2022 compared to H2 2021
more bookings in May 2022 than in May 2019 (pre-pandemic)
growth in bookings from airports since 2021
more bookings from hotels since 2021
Takeaways per region compared to the previous year
increase in bookings across Europe in Q1 2022 compared to 2021
increase in bookings across UK & IE in Q1 2022 compared to 2021
increase in bookings across AU & NZ in Q1 2022 compared to 2021
increase in bookings across US & CA in Q1 2022 compared to 2021
Introduction
In early 2022, as global business resumed with easing regulations, various business sectors, including taxi and travel, operated with more freedom, and measures like wearing masks and vaccinations became a matter of personal choice rather than a requirement. The taxi industry, since then, has been witnessing steady growth.
With new and innovative technology trends leading the current global taxi industry, the progress in technology has completely changed the face of the industry and how people use private hire services worldwide.
Tools like purpose-made devices for booking taxis are seeing success in providing passengers with the utmost simplicity and safety, meeting rising demand. According to a report, the global ride-hailing services market was worth USD 44.8 billion in 2021, with a 16.9% CAGR from 2022 to 2030. The survey also highlights that 15 million ride-hailing trips occur daily, expected to skyrocket to 100 million by 2030.
Reviewing the previous report
According to the previous findings, unless the government implemented any restrictions, the global taxi industry was expected to be back on track by Q2 2022. January 2022 to March 2022 witnessed a series of new variants followed by changes in government policies.
However, the number of B2B taxi bookings during this time shows an increasing trend, while the growth was slightly slower than the forecast. Graph 1 illustrates that in April, May and June 2022, global B2B taxi bookings came closest to the number of bookings in 2019 since the commencement of the pandemic.
Between April 2022 to June 2022, the industry witnessed 524% more in global B2B taxi bookings than in the same period in 2020 and 95% more as compared to 2021.
Nevertheless, the global taxi industry didn't meet the expected mark, and the number of trips was 14% less than in the pre-covid period in 2019.
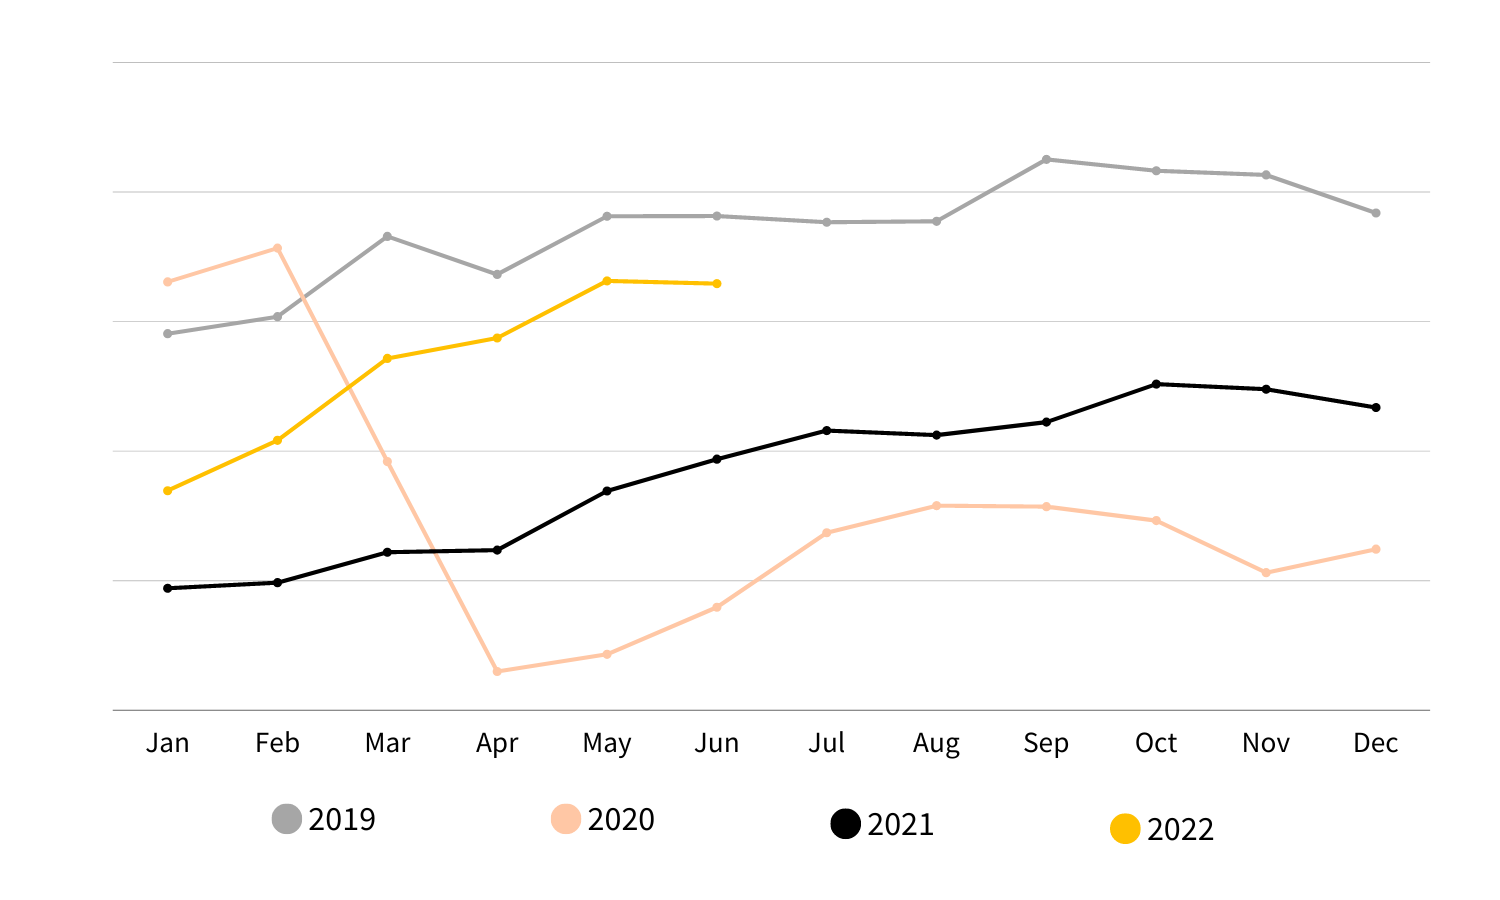 Graph 1: Comparison of monthly taxi bookings in 2019, 2020, 2021 and 2022
Picking up right where we left off
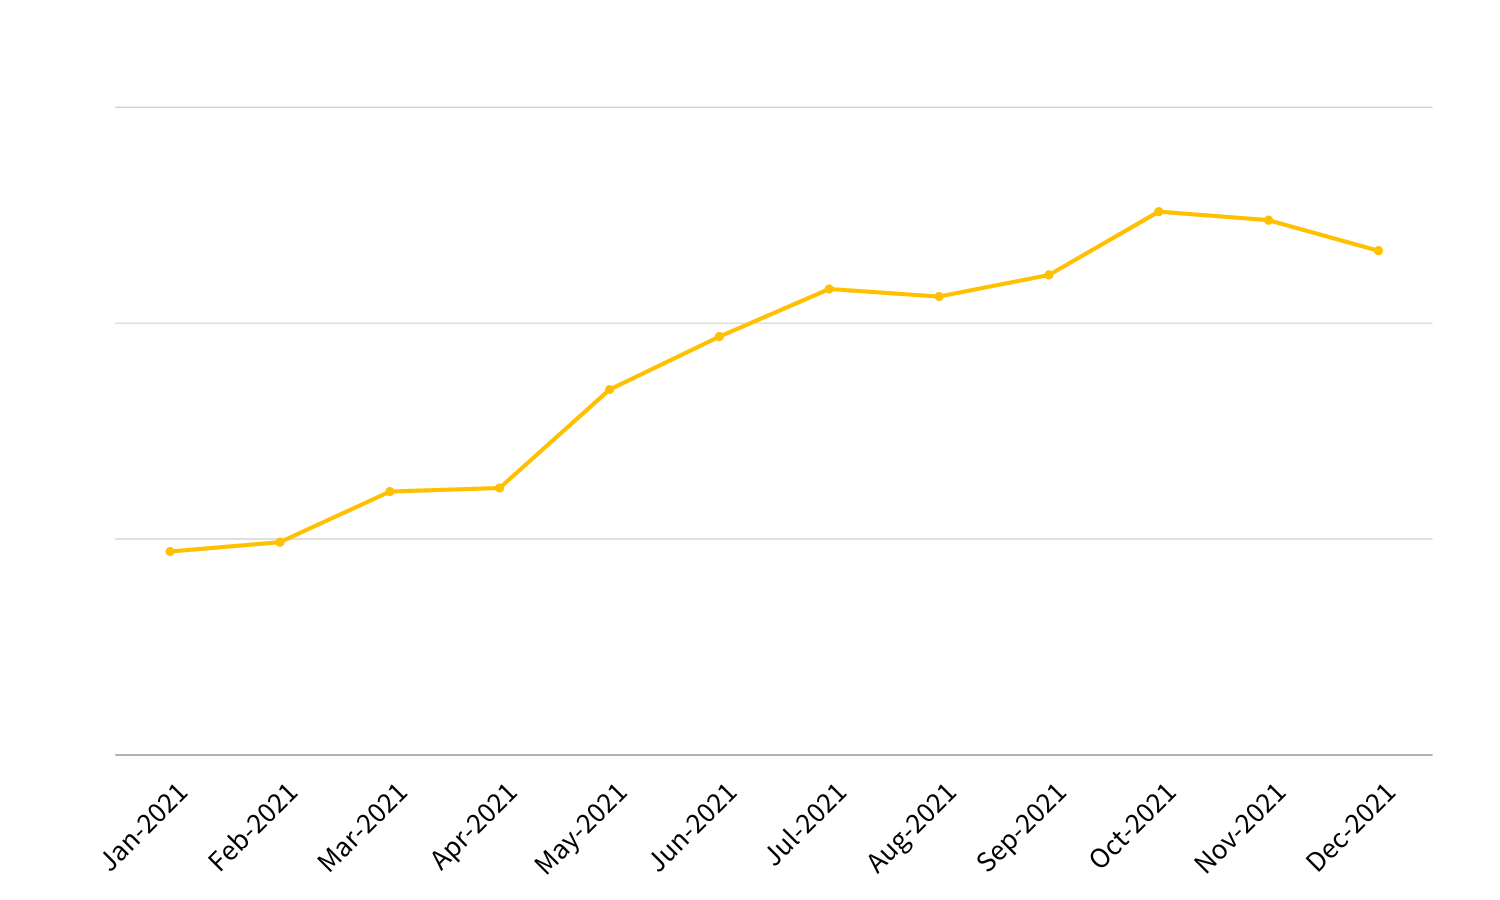 Graph 2: Monthly taxi bookings in 2021
With the easing of travel restrictions in most parts of the world, the overall growth trend of B2B taxi bookings in 2021 demonstrates a gradual growth, with the highest bookings witnessed in October with 72% more bookings, as opposed to the previous year. July 2021 sparked another surge in cases of COVID-19. Despite the delta variant spreading faster than earlier strains of the virus, Q3 2021 witnessed a slow but steady increase.
Following COVID-19 precautions, vaccinations and the use of rapid antigen tests helped reduce the transmission in late 2021. Q4 may have a decline in bookings as compared to Q3 of the same year; however, it witnessed 95% more taxi bookings than the same period in 2020, which was significant progress.
Transition into 2022
The pandemic has impacted the demand for taxis in 2020, 2021, and 2022, leaving an indelible mark on the industry. However, global taxi bookings have been steadily growing from January 2021 until June 2022. Oct 2021 through Jan 2022 saw a drop in taxi bookings. In early 2022, new Covid variants resulted in tighter restrictions, cancelling several New Year's Eve events and celebrations worldwide. Even though the industry operated with a quarter of the average number of cars, Graph 3 illustrates that January 2022 saw a notable increase of 180% in bookings than in January 2021.
The first half of 2022 saw an average growth of 242%, as compared to the same period of the previous year.
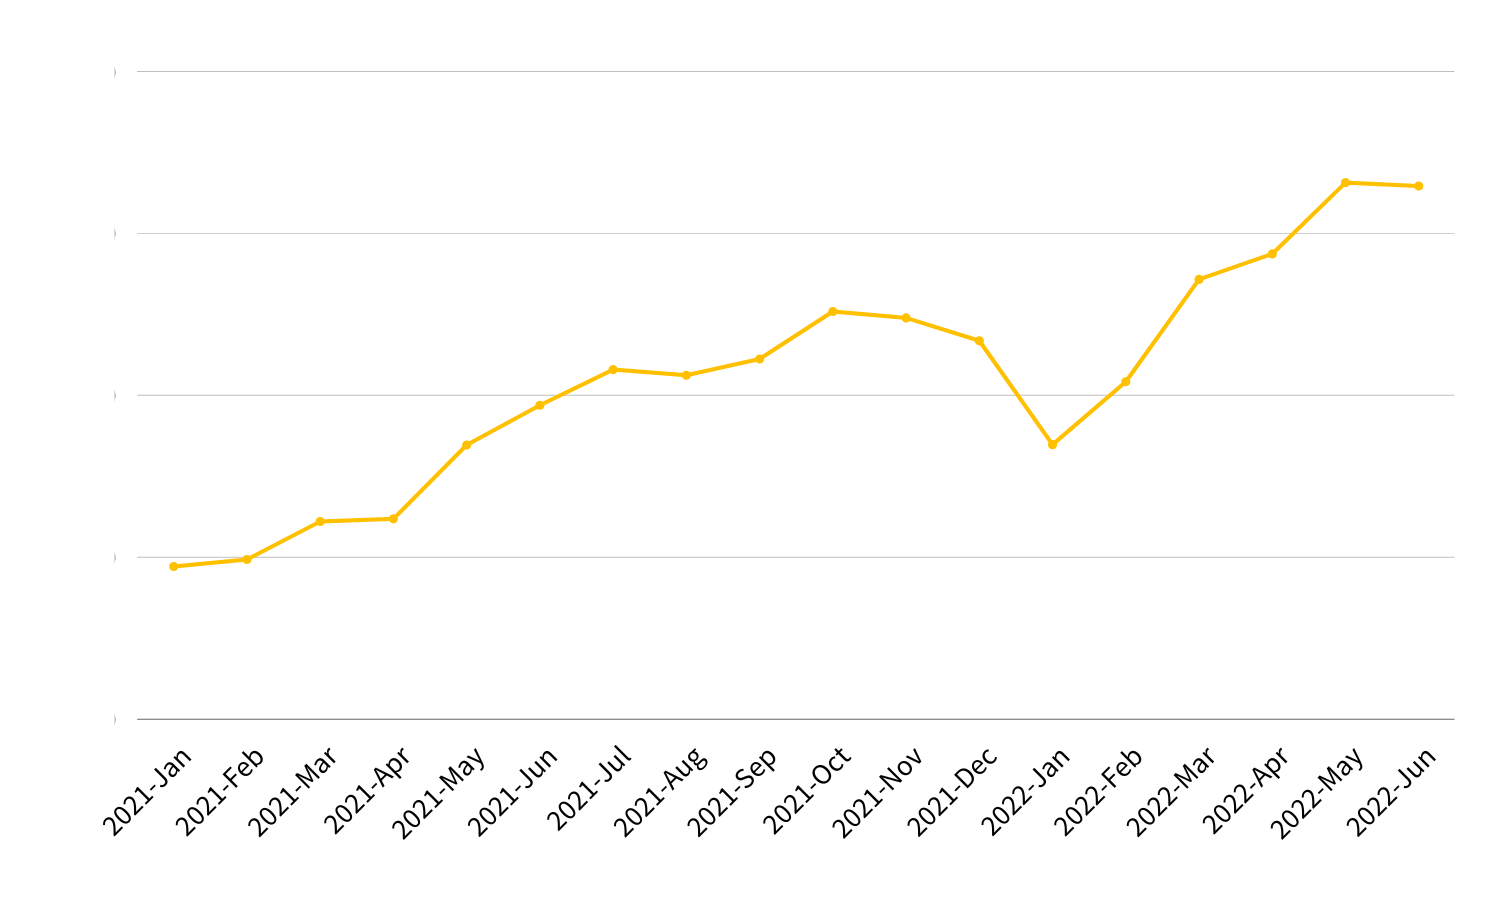 Graph 3: Number of B2B taxi bookings from Jan 2021 to June 2022
By mid-January, businesses and international travel had resumed, gradually easing all regulations, and the taxi industry was bouncing back. As public venues opened for business, there was an increased demand for public transportation, especially taxis. Q1 2022 witnessed a whopping 107% more trips than in Q1 2021. February 2022 had 112% more bookings than in Feb 2021, with promising growth from that point onwards, as consumers' preferences were slowly switching back to private transportation. By Q2, after a tough couple of years, local taxi drivers and taxi companies were thrilled to see more travellers filling the cities. As demand for B2B taxi booking continues to improve, Q2 2022 experienced 95% more bookings than Q2 2021.
Taking a closer look at graph 3, the transition from 2021 to 2022 witnessed a boost in the total number of taxi bookings. Although Q2 2022 saw 14% less than Q2 2019, the graph illustrates encouraging growth compared to 2020 and 2021.
Taxi bookings across the regions in 2022
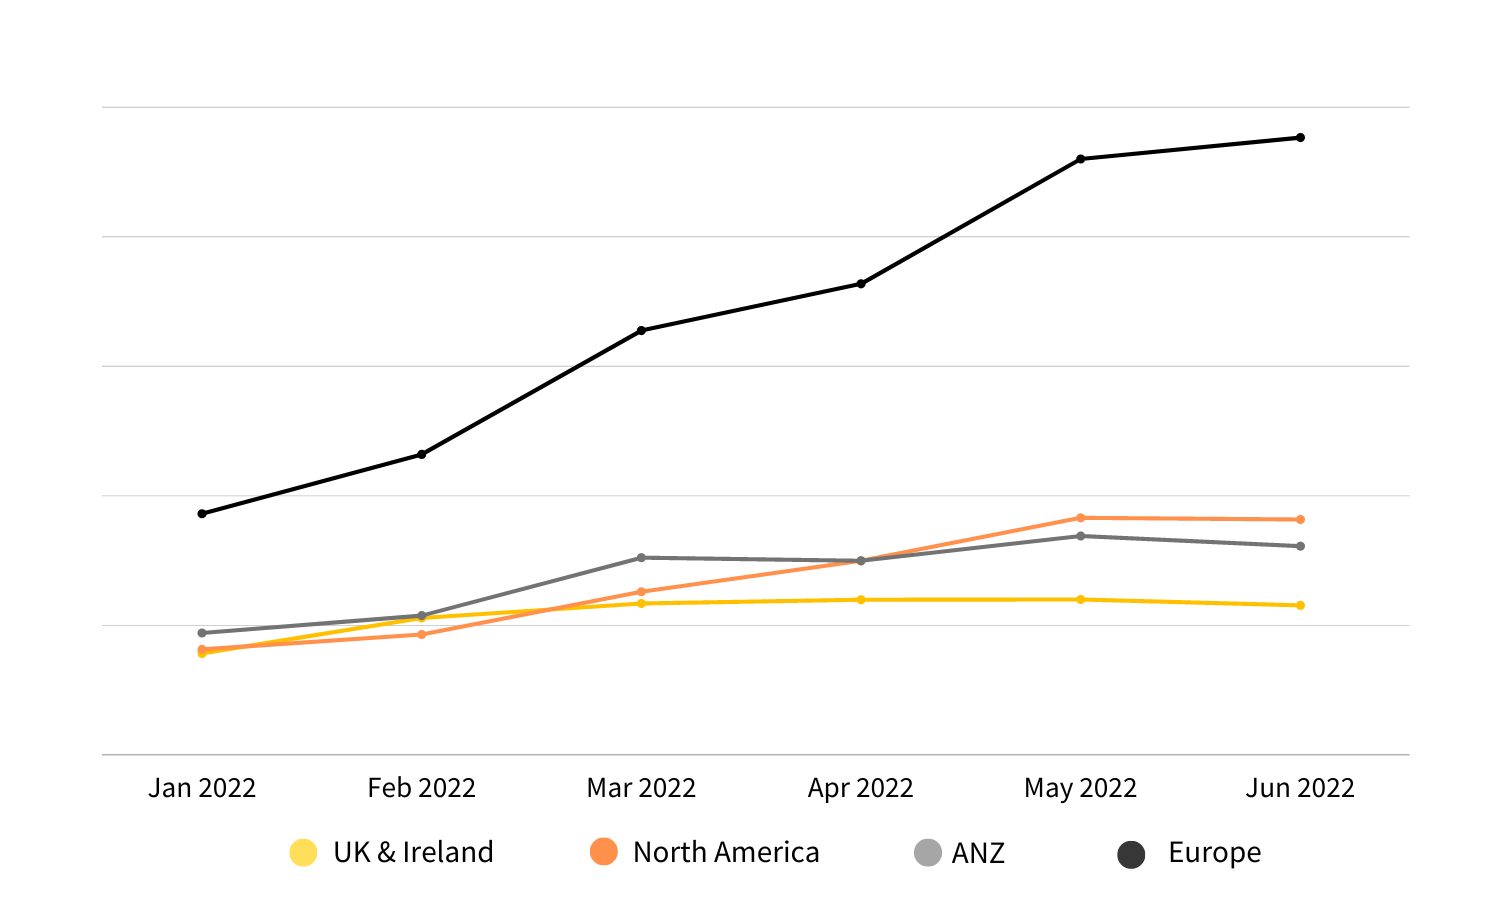 Graph 4: Taxi bookings per venue in UK and Ireland, North America, ANZ and Europe
Taxi bookings follow a similar trend regardless of the regions analysed in this study. Four different regions considered in the report are UK & Ireland, North America, Australia & New Zealand, and Europe (see graph 4).
Europe witnessed a significant improvement in 2022. Q1 2022 saw a 176% rise, and Q2 2022 showed a 184% rise in B2B taxi booking compared to the previous year. The growth projection for the ride-hailing & taxi segment in Europe is increasing by 7.15% (2022-2026), resulting in a market volume of US $52.98bn in 2026.
Despite the taxi trade witnessing substantial demand in the UK, the driver shortage has adversely impacted the taxi industry. Various reasons contributed to the shortage: costly licensing, better work elsewhere, low wages, backlogs in drivers' background checks and many more.
However, despite the challenges, the UK and Ireland have witnessed a 557% increase in Q1 2022 compared to Q1 2021. In Q2 2022, with the global travel sector reviving, the UK taxi industry saw an increase of 122% in B2B taxi booking compared to Q2 of the previous year in 2021.
Australia's border policies and lockdowns came at a cost where the taxi industry and other sectors became casualties of the pandemic. At the end of 2021, authorities decided it was time to live with the virus - restrictions were relaxed and international borders were partially opened, with the promise of allowing more international travellers. In Q1 2022, ANZ saw a 6% increase in B2B taxi booking compared to the previous year. Q2 2022 witnessed a significant shift in how people used local taxi services worldwide as the automated taxi booking system became available, enhancing customer experience. In Q2 2022, B2B taxi booking in ANZ witnessed a rise of 47%, 394%, and 24% compared to Q2 2019, Q2 2020 and Q2 2021 respectively.
Initially, as travel restrictions and lockdowns were strict in North America, the taxi industry took a blow but recovered quickly once the conditions eased in 2022.
North America witnessed a bumpy yet steady rise in taxi bookings, where Q1 2022 saw an 87% increase in B2B taxi bookings than Q1 of the previous year. In Q2 2022, it experienced a 41% increase compared to Q2 2019, a whopping climb of 446% compared to Q2 2020, and 100% compared to Q2 2021.
A look at bookings across different types of venues
With businesses and international travel back in full swing, taxi bookings across different types of venues also looked promising in 2022 compared to 2021 and 2020 in almost all the venue types.
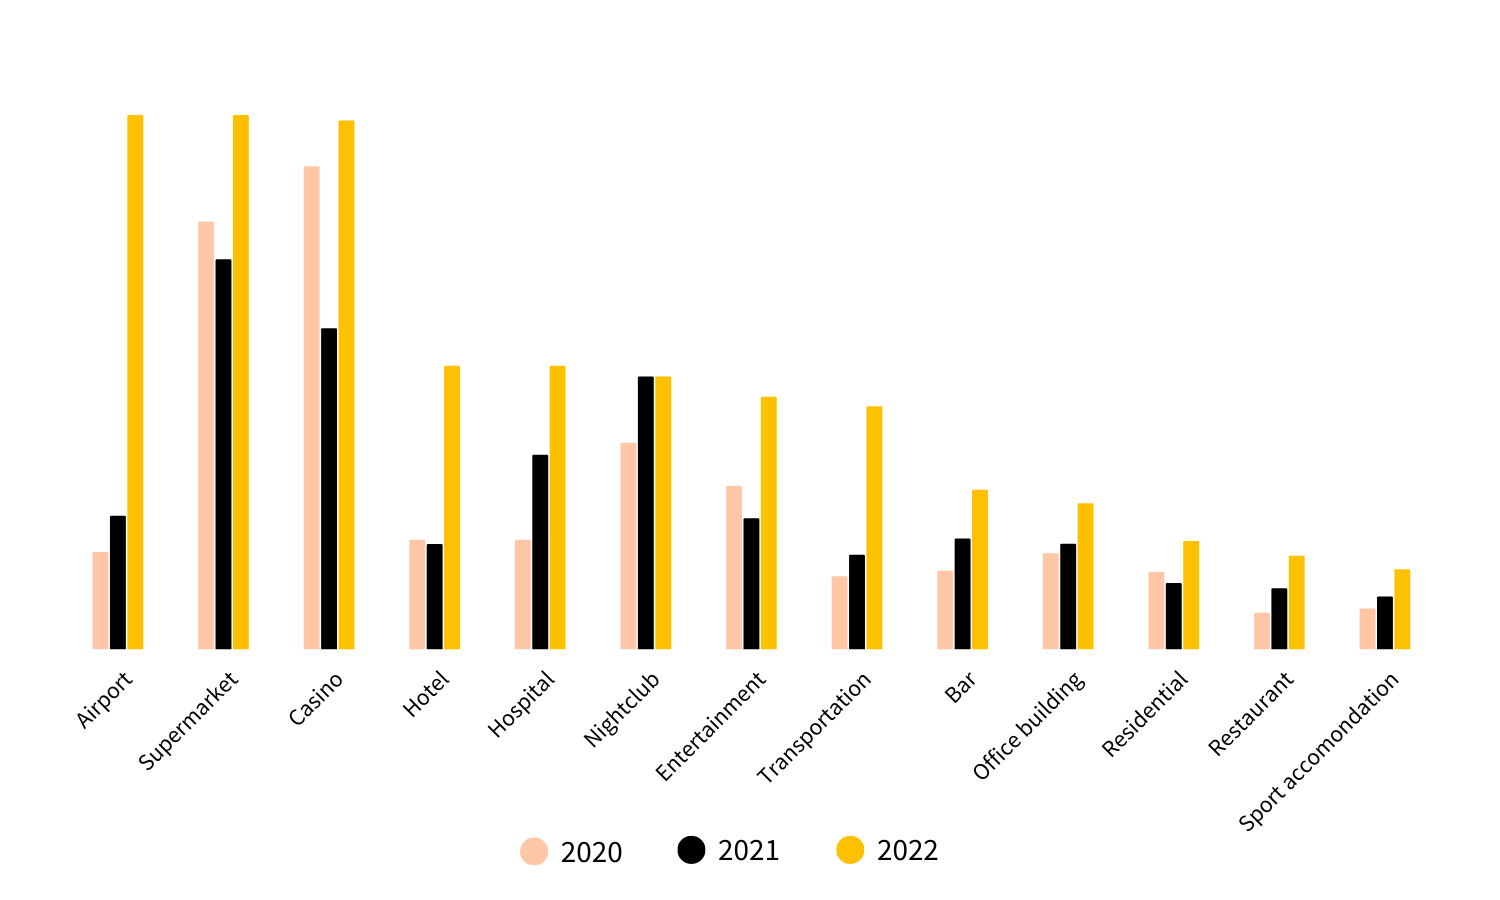 Graph 5: Taxi bookings per venue type in 2020, 2021, and 2022
Graph 6 shows the average number of bookings per device per venue type in 2022. Airports have witnessed the most significant growth in B2B taxi bookings, with a 300% and 450% increase since 2021 and 2020. The beginning of 2022 was relatively higher for venues like airports, followed by a similar trend with hotels which witnessed a 169% rise, casinos with a 65% rise, and supermarkets with a 37% climb in B2B taxi bookings per device compared to H1 2021.
The most significant change is that hotels have seen almost 2.5 times more bookings than in previous years and supermarkets received fewer bookings per location, a decreasing trend since 2020.
Conclusion
2022 was a reassuring year for the global taxi booking industry, especially compared to 2020 and 2021. The impact of the pandemic on the taxi industry could not have been foreseen, despite this, the industry has steadily grown since January 2021, and in Q2 2022, witnessed a total growth of 49% compared to the previous year. Adopting technologies like automated taxi booking systems has enhanced end-to-end user experiences, with venues such as hotels, casinos, and supermarkets witnessing a 169%, 65% and 37% increase in bookings compared to H1 2021.
As we emerge from the pandemic, 2023 is the year the global taxi booking industry is looking forward to shaping its future. Without having fully recovered since 2019, the taxi industry still looks more robust than ever to meet increasing demand.
Methodology
The dataset presented includes the total number of successful taxi bookings made using Taxi Butlers, that are placed in venues (hotels, bars, restaurants, etc.) across the globe since 2019, by month, year, and country. For the dataset presenting comparisons between the different regions, the data has been aggregated and normalised. As Taxi Butler has a different amount of devices in each region, an absolute comparison was not possible. The data was averaged per device, per country, and then normalised using standard deviation and the mean. The remaining dataset is absolute, presenting the actual measured amount of bookings per year or month. The regions can be defined as follows:
- UK & Ireland: England, Scotland, Wales, Northern Ireland, and Ireland.
- North America: The United States of America and Canada
- Europe: Germany, Netherlands, Spain, France, Finland, Bulgaria, Romania, Denmark, Belgium, Poland, Austria, Portugal, Italy, and Switzerland
- All countries (52 in total): Great Britain, Australia, United States, Germany, Canada, Spain, Finland, Bulgaria, France, Denmark, Ireland, New Zealand, Netherlands, Romania, Belgium, Portugal, United Arab Emirates, Poland, Iceland, Austria, Oman, Montenegro, Latvia, Luxembourg, Sweden, Argentina, Turkey, Russia, Italy, Lithuania, Norway, Switzerland, Lebanon, Ukraine, Georgia, Iraq, Somalia, Greece, Cyprus, Moldova, Maldives, Uruguay, Uzbekistan, Albania, Jordan, Curacao, Japan, Malta, Reunion, Brazil, Tajikistan, and American Samoa.
Glossary
Disclaimer
This report is intended for general guidance and information purposes only. The material in the report is obtained from various sources as per the methodology. We have taken reasonable care to ensure that, and to the best of our knowledge, material information contained herein is in accordance with the facts and contains no omission likely to affect its understanding. The estimates are subject to risks, uncertainties and other factors that may cause actual events to differ materially from any anticipated development. Please note that we make no assurance that the underlying forward-looking statements are free from errors. The information contained herein may be subject to changes without prior notice. Taxi Butler B.V. does not accept any form of liability, neither legally nor financially, for loss (direct or indirect) caused by the understanding and/or use of this report or its content.