The data that defined
Quarter 3 of 2023
Discover the top trends, data and statistics
that defined the industry last quarter.
Contents
Highlights & hot topics 🔥
9.1% growth in September
Following a 4-month dip, September sees the first signs of market growth with a 9.1% increase of bookings since August.
10.4% increase for UK&IE
After a ‘so-so’ end of 2022, the UK & Ireland see a steady increase in bookings throughout 2023, with a 10.4% increase in Q3 compared to Q2 2023.
6.8% decline since last year
Similarly to Q2, Q3 performed worse than the same period last year, with 6.8% fewer bookings.
How’s the industry looking in your region? 🌎
Discover how UK & Ireland, ANZ, North America and Europe performed last quarter.
The next-level QR code taxi booker
👋 Say hi to Taxi Butler’s Guest QR, the next-generation QR taxi booker that generates automated taxi bookings from anywhere inside hotels, bars, and restaurants.
Global taxi booking data 📊
Q3 2023 in context
How does look Q3 2023 look compared to the last 12 months?
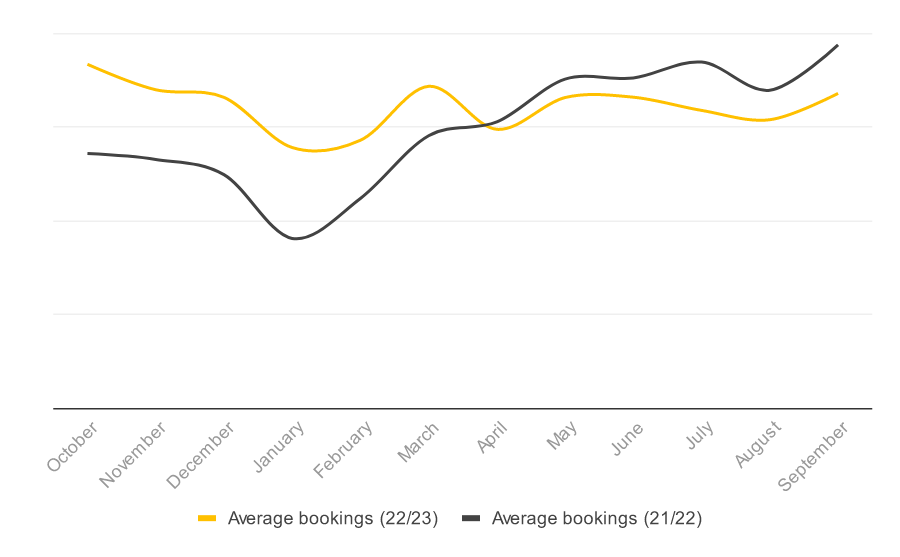
Graph #1: Line chart showing the average global B2B taxi bookings from the last 12 months compared to the same period of the previous year.
Standstill for Q3 2023
On average, Q3 had the same number of bookings than in Q2 2023.
9.1% growth in September
Following a 4-month dip, September sees the first signs of market growth with a 9.1% increase of bookings since August.
A deep dive into last quarter
Weekly B2B taxi bookings throughout the quarter
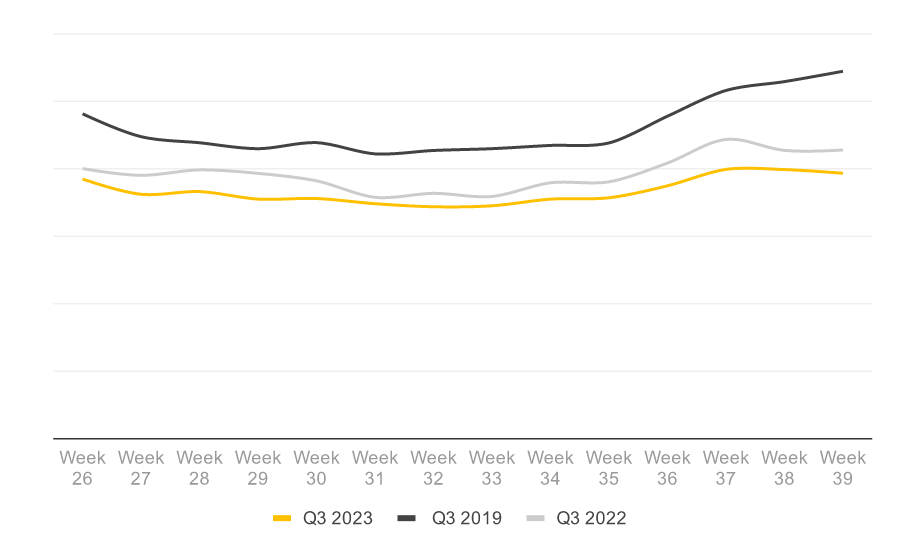
Graph #1: Line chart showing the average global B2B taxi bookings from last quarter on a weekly basis and a comparison line for 2019, the last pre-COVID year, and 2022.
Week 37 & 38
Week 37 and 38 of Q3 2023 observed the highest number of bookings in comparison to the other weeks.
Week 32
Week 32 saw the fewest number of bookings.
0.1% growth last quarter
The average week-over-week growth in Q3 2023 was 0.1%. Last quarter started and finished at around the same point and had a shallow dip in between.
6.8% less than last year
Comparing with the same period last year, Q3 2023 saw 6.8% less bookings than Q3 2022.
14% less than 2019
Q3 2023 saw 14% less bookings than Q3 2019.
Best-performing types of venues
Bookings per type of venue
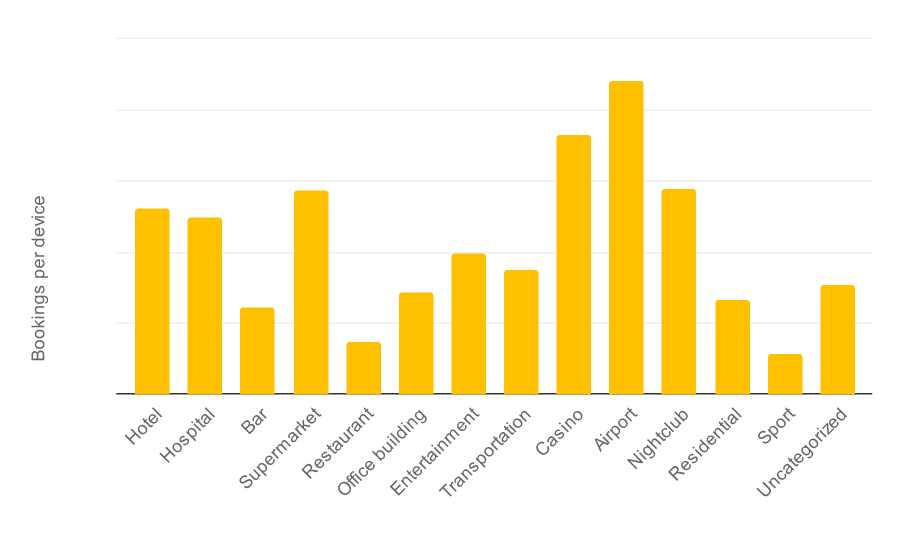
Graph #3: Bar chart comparing the average number of bookings for each venue type.
Airports reign again 🛫
Summer was here recently, and so was the reign airports, topping the leaderboard with 15% more bookings than the previous quarter.
Rankings compared
| # | Venue type | % Change | # Change |
|---|---|---|---|
| 1 | Airports | +15% | +1 |
| 2 | Casinos | -5.2% | -1 |
| 3 | Nightclubs | 13.8% | +2 |
| 4 | Supermarkets | +3.1% | -1 |
| 5 | Hotels | -0.3% | -1 |
Changes shown are since the last quarter.
A glance at the regions
Bookings per region
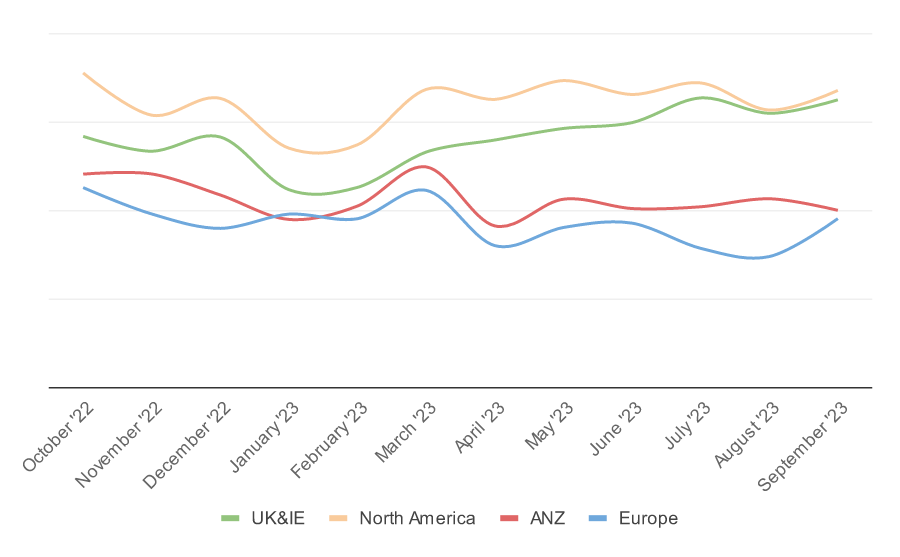
Graph #4: Line chart comparing the average number of bookings for each of the regions.
10.4% growth for UK&IE
North America maintained its position as best best-performing region. However, UK&IE came very close in Q3 2023, where North America saw a 1% decrease in performance compared with Q2 2023, UK&IE made a jump of 10.4% to nearly take the top spot.
Rankings compared
| # | Region | % Change |
|---|---|---|
| 1 | North America | -1% |
| 2 | UK&IE | 10.4% |
| 3 | ANZ | 3.4% |
| 4 | Europe | -5.6% |
Changes shown are since the last quarter.
Taxi booking data in your region 🌎
Use the buttons below to choose your region and see local data.
UK & Ireland 🇬🇧🇮🇪
Weekly B2B taxi bookings
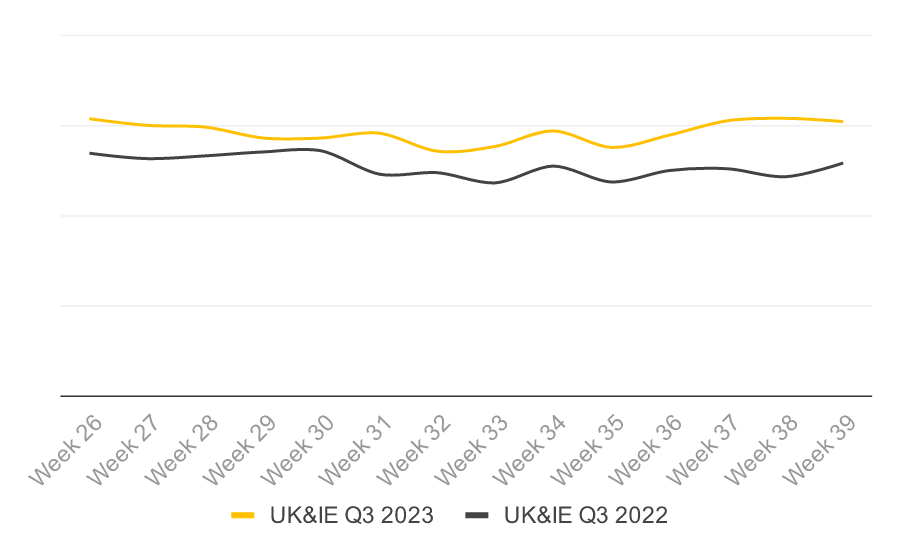
Graph #5: Line chart showing the average B2B taxi bookings for the selected region from last quarter on a weekly basis and a comparison line for 2022.
0.2% decrease
The average week over week growth in Q3 2023 was -0.2%.
14.7% more than Q3 2022
14.7% higher average bookings in Q3 2023 than Q3 2022.
North America 🇺🇸🇨🇦
Weekly B2B taxi bookings
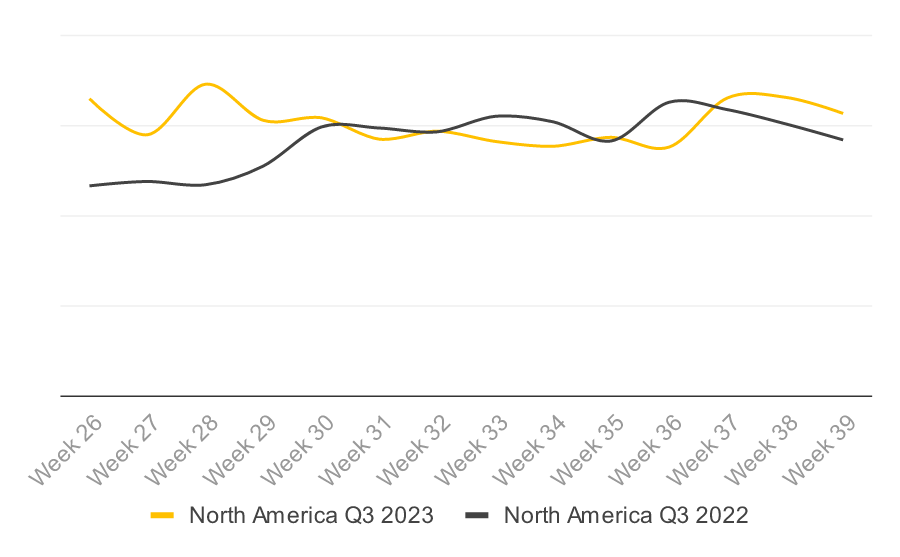
Graph #6: Line chart showing the average B2B taxi bookings for the selected region from last quarter on a weekly basis and a comparison line for 2022.
0.8% decrease this quarter
The average week-over-week growth in Q2 2023 was -0.8%.
7% more than Q3 2022
7% more bookings in Q3 2023 than Q3 2022.
ANZ 🇦🇺🇳🇿
Weekly B2B taxi bookings
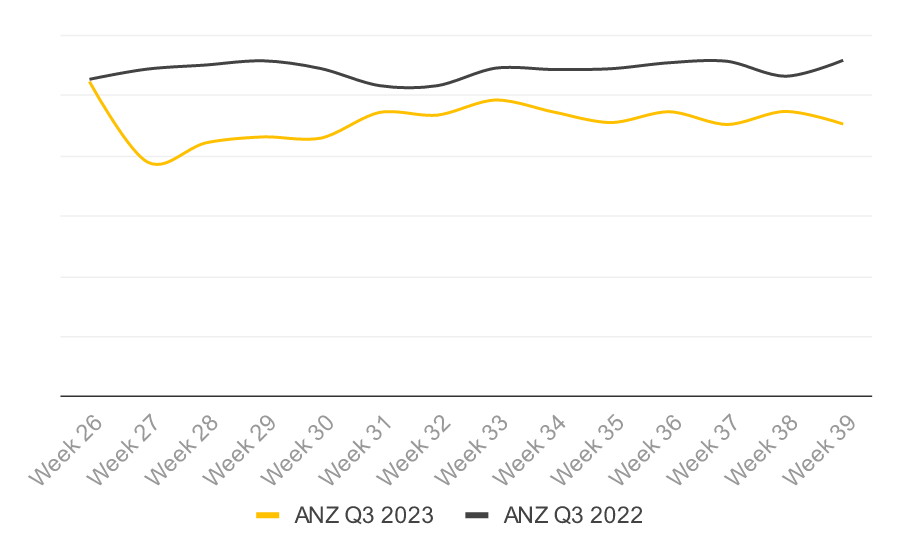
Graph #7: Line chart showing the average B2B taxi bookings for the selected region from last quarter on a weekly basis and a comparison line for 2022.
1.6% decrease
The average week over week growth in Q3 2023 is -1.6%.
15.6% less than Q2 2022
15.6% less bookings in Q3 2023 than Q3 2022.
Europe 🇪🇺
Weekly B2B taxi bookings
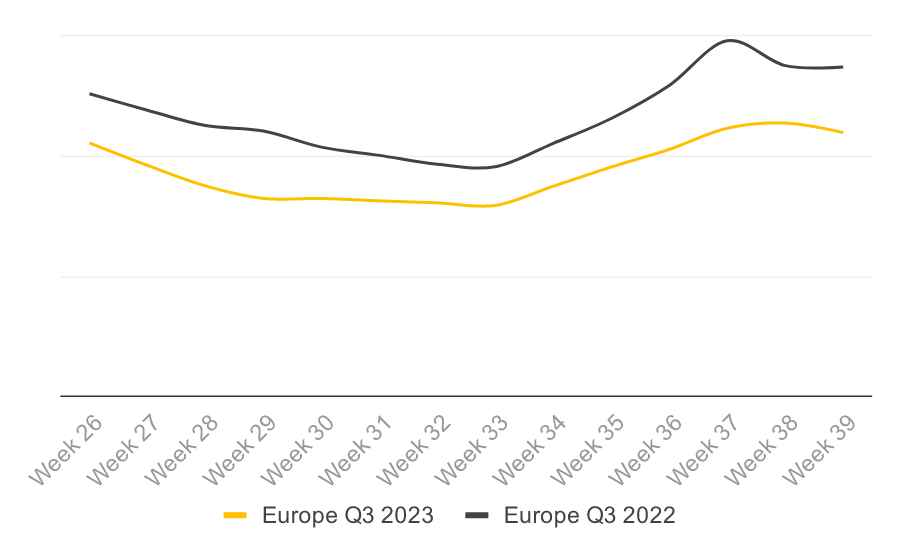
Graph #8: Line chart showing the average B2B taxi bookings for the selected region from last quarter on a weekly basis and a comparison line for 2022.
0.1% decrease
The average week over week growth in Q2 2023 is -0.1%.
19.6% less than Q3 2022
19.6% less bookings in Q3 2023 than Q3 2022.
About this report 👏
Taxi Butler develops unique, purpose-built taxi booking technology that makes ordering taxis easier for venues like hotels, bars, and restaurants. Hundreds of fleets across the world use this technology to generate, automate and manage taxi bookings from their local venues.
The dataset presented includes the total number of successful taxi bookings made using Taxi Butlers, that are placed in venues (hotels, bars, restaurants, etc.) across the globe since 2019, by month, year, and country. The data has been aggregated and normalised. As Taxi Butler has a different amount of devices in each region, an absolute comparison was not possible. The data was averaged per device, per country, and then normalised using standard deviation and the mean. The regions can be defined as follows:
- UK & Ireland: England, Scotland, Wales, Northern Ireland, and Ireland.
- North America: The United States of America and Canada
- Europe: Germany, Netherlands, Spain, France, Finland, Bulgaria, Romania, Denmark, Belgium, Poland, Austria, Portugal, Italy, and Switzerland
- All countries (52 in total): Great Britain, Australia, United States, Germany, Canada, Spain, Finland, Bulgaria, France, Denmark, Ireland, New Zealand, Netherlands, Romania, Belgium, Portugal, United Arab Emirates, Poland, Iceland, Austria, Oman, Montenegro, Latvia, Luxembourg, Sweden, Argentina, Turkey, Italy, Lithuania, Norway, Switzerland, Lebanon, Ukraine, Georgia, Somalia, Greece, Cyprus, Moldova, Maldives, Uruguay, Uzbekistan, Albania, Jordan, Curacao, Japan, Malta, Reunion, Brazil, Tajikistan, and American Samoa.
- B2B taxi booking
- A B2B taxi booking is a successful booking that has been placed by a Taxi Butler at a venue.
- Successful booking
- A successful booking is a booking that has been placed and accepted by a taxi driver and confirmed to have arrived at the desired location.
- Taxi Butler
- A taxi booking device that allows venue staff to book taxis for their guests in one click.
- Venues
- Venues can be any public business or place, where a taxi is booked from. The dataset primarily includes venue types like hotels, bars, restaurants, casinos and hospitals.
Disclaimer 🗒️
This report is intended for general guidance and information purposes only. The material in the report is obtained from various sources as per the methodology. We have taken reasonable care to ensure that, and to the best of our knowledge, material information contained herein is in accordance with the facts and contains no omission likely to affect its understanding. The estimates are subject to risks, uncertainties and other factors that may cause actual events to differ materially from any anticipated development. Please note that we make no assurance that the underlying forward-looking statements are free from errors. The information contained herein may be subject to changes without prior notice. Taxi Butler B.V. does not accept any form of liability, neither legally nor financially, for loss (direct or indirect) caused by the understanding and/or use of this report or its content.